[section label=1. Introduction]
SanDisk’s Most “Extreme” SSD Ever
 When SanDisk first introduced the Extreme II SSD last year, it easily ranked as one of the best enthusiast SSDs on the market. Unlike many enthusiast SSDs which can reach top performance only in light workloads, the Extreme II is also capable of top, consistent performance even after heavy, extended use. At the time, this was a fairly new aspect of enthusiast SSD performance which was generally only a metric in the enterprise space.
Recently at Computex early last month, SanDisk unveiled the successor to the SanDisk Extreme II, the SanDisk Extreme PRO which we have the opportunity of reviewing today. Like the SanDisk Extreme II before it, the SanDisk Extreme PRO is designed for users such as media professionals, gamers, and PC enthusiasts who not only demand fast, but also consistent performance.
SanDisk Extreme PRO Specifications
| Manufacturer | SanDisk | SanDisk | SanDisk |
|---|---|---|---|
| Model | Extreme PRO | Extreme PRO | Extreme PRO |
| Form Factor | 7mm, 2.5″ SATA | 7mm, 2.5″ SATA | 7mm, 2.5″ SATA |
| Capacity | 240GB | 480GB | 960GB |
| Controller | Marvell 88SS9187 | Marvell 88SS9187 | Marvell 88SS9187 |
| NAND | SanDisk 19nm eX2 ABL Toggle Mode MLC | SanDisk 19nm eX2 ABL Toggle Mode MLC | SanDisk 19nm eX2 ABL Toggle Mode MLC |
| Sequential Reads | 550 MB/s | 550 MB/s | 550 MB/s |
| Sequential Writes | 520 MB/s | 515 MB/s | 515 MB/s |
| 4K Random Read | 100,000 IOPS | 100,000 IOPS | 100,000 IOPS |
| 4K Random Write | 90,000 IOPS | 90,000 IOPS | 90,000 IOPS |
| Interface | SATA 3 6Gb/s | SATA 3 6Gb/s | SATA 3 6Gb/s |
| Endurance | >80 TBW | >80 TBW | >80 TBW |
| Warranty | 10 Years | 10 Years | 10 Years |
The SanDisk Extreme PRO will come in only three capacities – 240GB, 480GB, and 960GB. It’s nice to see that capacities such as 120/128GB are finally being dropped from SSD lineups thanks to ever increasing die sizes, ever increasing dies per package, and ever decreasing prices. As far as internals go, the SanDisk Extreme PRO isn’t much different from the SanDisk Extreme II. In fact, it’s using the exact same Marvell 88SS9187 “Monet” controller as well as pretty much the exact same in-house proprietary 19nm eX2 ABL Toggle Mode MLC.
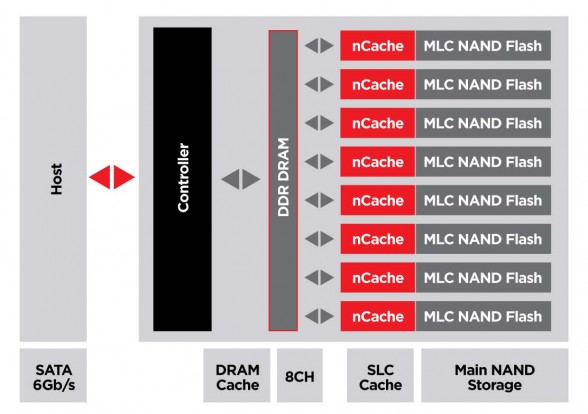
What’s different about the new SanDisk Extreme PRO however, is mostly a reworked firmware and an enhanced version of nCache, which SanDisk calls nCache PRO.
For those who aren’t familiar nCache from some of SanDisk’s previous SSDs, nCache is basically a repurposed portion of the main MLC storage which acts as a SLC cache. This SLC nCache is used to store mapping tables along with small write segments which is then later flushed to the main MLC flash storage.
By doing so, this provides two benefits. The first benefit is higher performance. As SLC is significantly faster than MLC, writes to the nCache would be a a lot faster than writes to the main MLC storage. This is pretty obvious. The second benefit is better data security. Without nCache, the mapping tables and small write segments would be stored in the volatile DRAM cache which would result in data loss in the event of a power failure. By using the non-volatile SLC cache to store mapping tables and small write segments, this problem is mostly avoided – the reason I say mostly is because SanDisk still employs the use of a DRAM cache in conjunction with nCache.
Since nCache is a proprietary technology, we’ve never really been given a whole lot of details regarding the actual changes between the old nCache and the new nCache PRO, but SanDisk did tell us that the capacity of nCache PRO is less than 1GB, similar to the older nCache implementations. Since the size of the cache is the same, my best guess is that nCache has been optimized to be more efficient although I doubt that there’ll be any massive performance improvements without significant increases to the size of the nCache.
Additionally, SanDisk is also doubling the warranty term on the drive, making it an industry leading 10 years – similar to the warranty we saw on the recently released Samsung 850 PRO. SanDisk is also rating the Extreme PRO at >80 TBW (Tera Bytes Written), which is slightly different than the hard and fast 80 TBW rating on the older Extreme II.
Let’s take a closer look at the drive.
[section label=2. A Closer Look]
A Closer Look at the SanDisk Extreme PRO 480GB
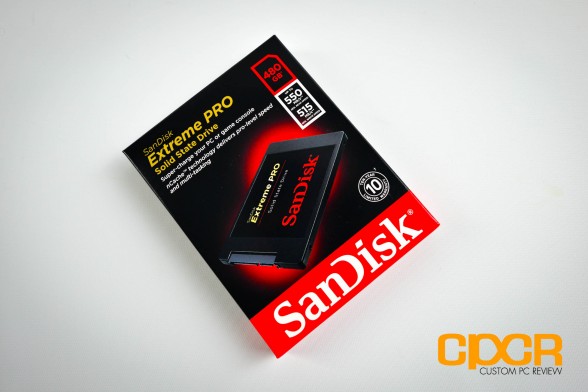
Here’s a look at the packaging for the SanDisk Extreme PRO 480GB.
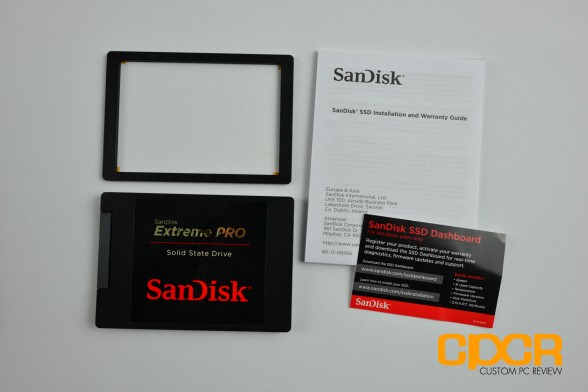
Included in the packaging we get some documentation, a 2mm riser, and the SanDisk Extreme PRO SSD.
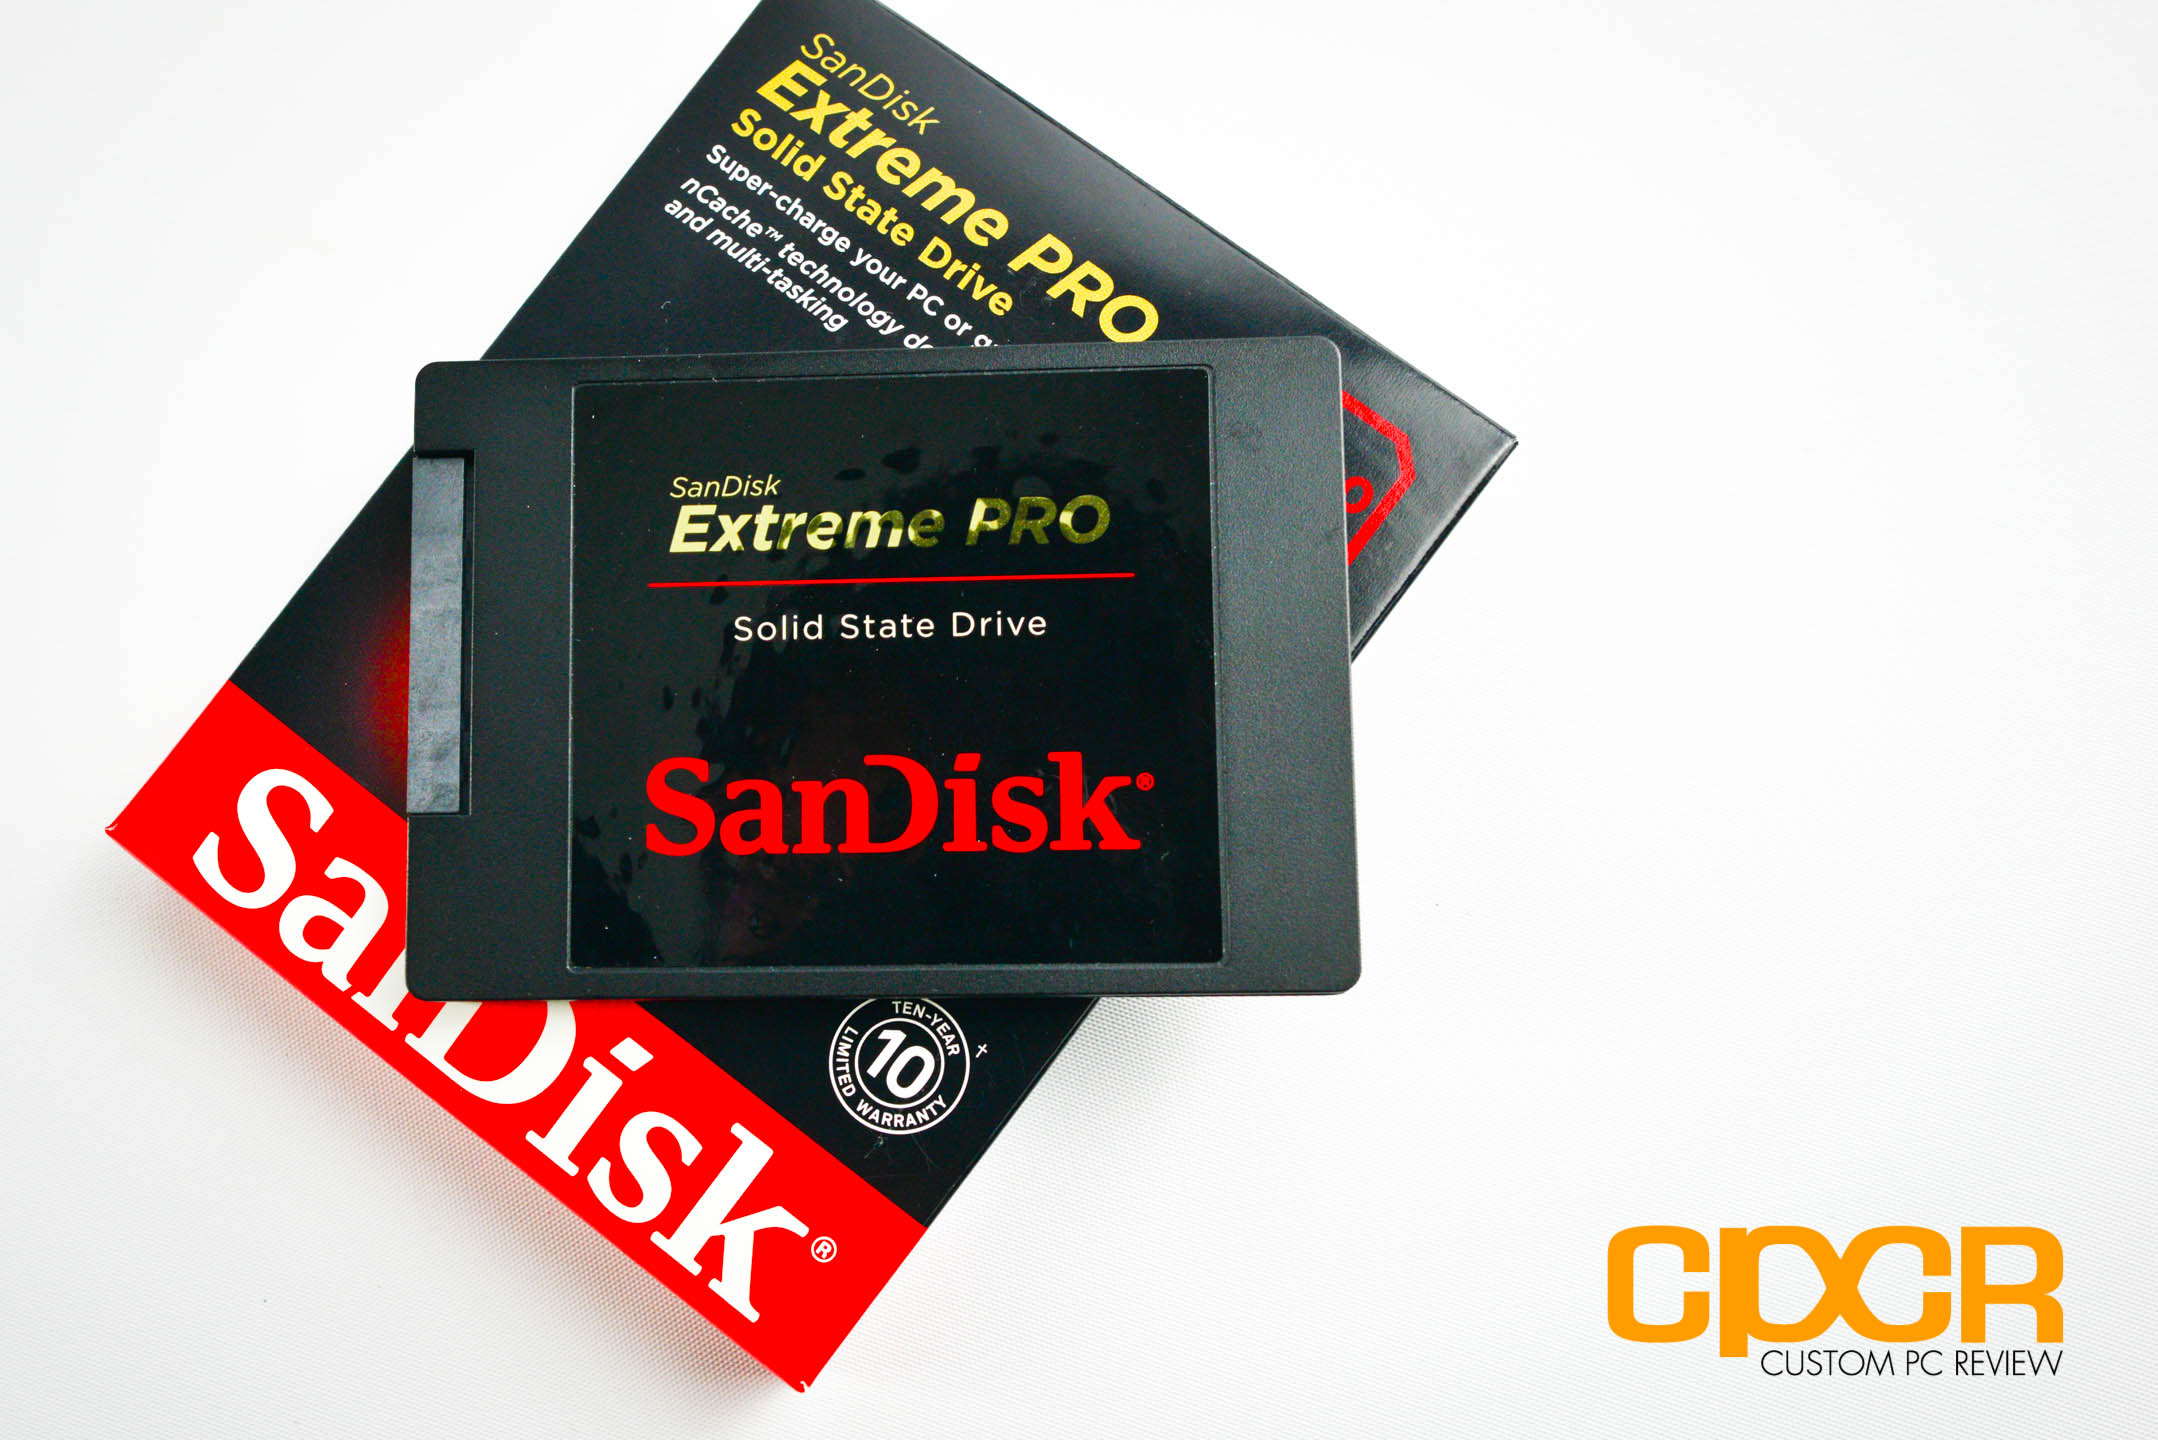
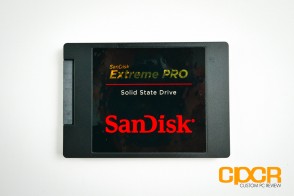
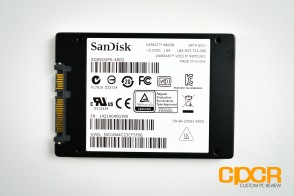
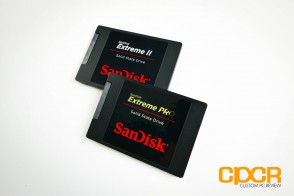
Here’s a closer look at the SanDisk Extreme PRO. There really hasn’t been a huge change since the Extreme II, so we’ve pretty much got the same 2.5″ 7mm thin casing as the Extreme II. Labels are nearly the same as well except the Extreme PRO has Extreme PRO labels.
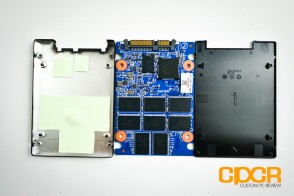
For the 480GB Extreme PRO, SanDisk is using a full size PCB, but thanks to ever increasing die capacities, only a single side of the PCB is necessary.
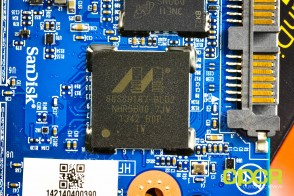
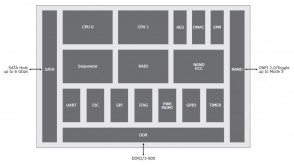
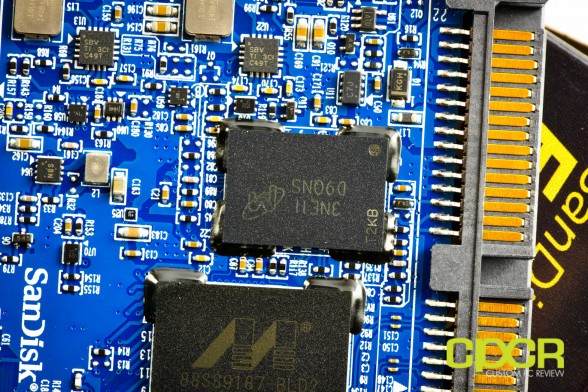
As mentioned previously, SanDisk hasn’t really changed much of the hardware going from the Extreme II to the Extreme PRO. Here we’re using the same 8 channel Marvell 88SS9187 “Monet” controller we’ve all become so familiar with. This continues to solidify the fact that controller firmware serves a much bigger role in SSD performance than the actual controller hardware itself.
Onboard the 480GB Extreme PRO we also get 1GB of Micron DDR3-1600 for the DRAM cache giving us 2MB DRAM per GB of total NAND capacity. With nCache, the DRAM onboard is probably used for mapping tables only, reducing the risk of user data loss in the event of a power failure.
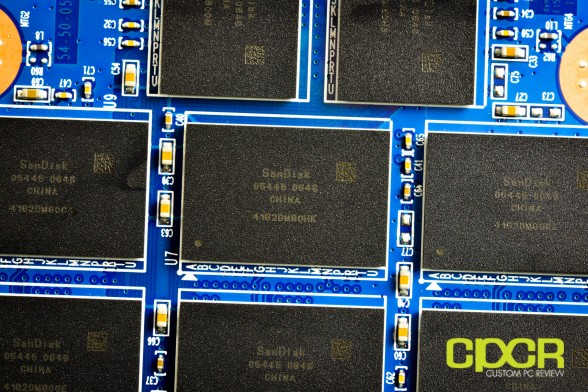
Here’s a look at the SanDisk 19nm eX2 ABL Toggle Mode MLC. It’s the same stuff used in the SanDisk Extreme II, so it’s nothing we haven’t seen before. In total there are 8 NAND packages on the 480GB Extreme PRO giving us a total NAND capacity of 512 GiB.
[section label=3. SanDisk SSD Dashboard]
SanDisk SSD Dashboard
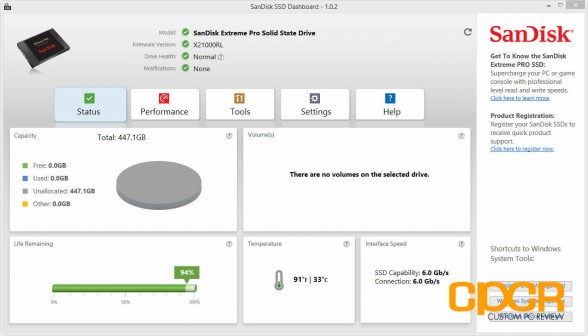
With the release of the SanDisk Extreme PRO, SanDisk also unveiled the SanDisk SSD Dashboard, which is a piece of companion software which allows Extreme PRO owners the ability to monitor their SSD, monitor performance, etc.
Upon loading up the SanDisk SSD Dashboard, we’re immediately taken to the status tab which gets us some tidbits of information about the SSD. Here we can see that our drive has an unformatted capacity of 447.1GB, 94% life remaining, it’s running at 33ºC, and it’s connected at the 6Gb/s rate. We also get information about the drive’s model, firmware version, health, etc.
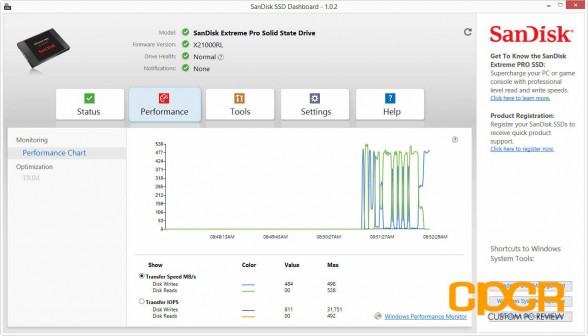
Moving into the performance tab, the software is also able to monitor performance of the drive in real time. This is pretty cool.
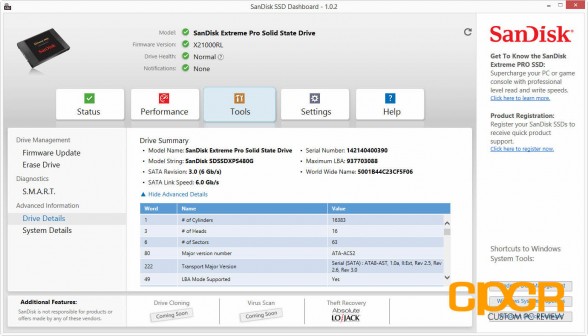
In the tools tab, we get an easy way to update firmware should a new firmware become available. There’s also a secure erase function, S.M.A.R.T. diagnostics checker, and drive/system details. SanDisk also offers integration with LoJack recovery software, but that does require a fee. It also appears drive cloning and virus scanning will be “coming soon” although no timeframe is specified.
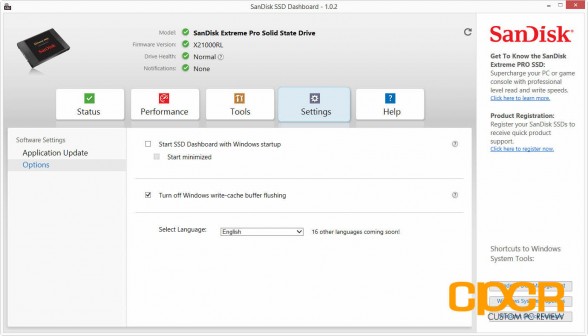
Here’s a look at the settings menu. SanDisk offers a very meager amount of options for SSD performance optimization, the only one of which is to turn off write cache buffer flushing. With Windows 8.1 and future versions of Windows better designed for SSD support, optimizations may not be necessary down the line.
Finally the help menu for those who need help. Self explanatory. Let’s move on.
[section label=4. Test Setup]
Haswell Test Bench
As of October 5, 2013, we’ve upgraded our storage testing system to a Z87/Haswell testing platform. All SSDs used for comparison here have been updated to the latest firmware as of October 2013. Performance tests from storage reviews prior to that date should not be compared to our latest reviews.
| System | CyberPowerPC Gamer Xtreme 4200 |
|---|---|
| CPU | Intel Core i7 4770K |
| Motherboard | ASUS Z87-A |
| Memory | Kingston HyperX Genesis 16GB DDR3 2133MHz |
| Graphics | Intel HD4600 Graphics |
| Storage | OCZ Vertex 4 256GB |
| Power Supply | Corsair HX650 |
| Case | HSPC High Speed Tech Station |
| Optical Drive | ASUS OEM DVD Drive |
| Operating System | Windows 8 64 bit & CentOS 6.4 |
Special thanks to CyberPowerPC, Kingston, OCZ Technology and HSPC for sponsoring our test bench!
Crystal Disk Info
SanDisk Extreme PRO 480GB
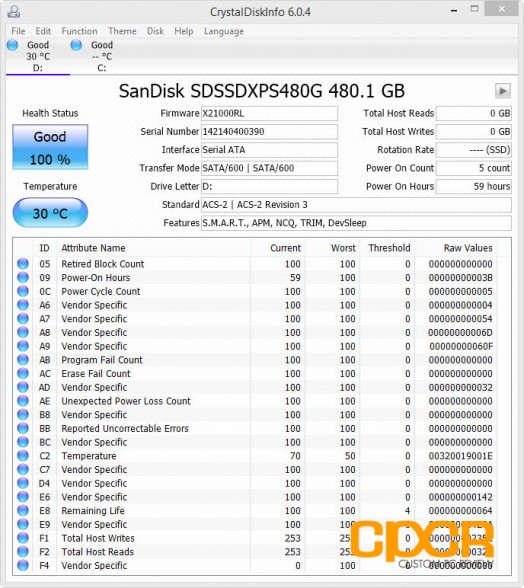
Today’s review will be on the SanDisk Extreme PRO 480GB SATA SSD with the firmware X21000RL. Like the SanDisk Extreme II, the SanDisk Extreme PRO is fairly full featured, supporting SMART monitoring, NCQ (Native Command Queueing), TRIM, and the ultra low power DevSleep state.
Unfortunately, SanDisk decided not to include more modern self encryption features such as TCG Opal 2.0 or IEEE-1667. These features are however available on SanDisk’s business/professional series SSDs such as the SanDisk X300s.
[section label=5. ATTO Disk Benchmark / AS SSD / Crystal Disk Mark]
SanDisk Extreme PRO 480GB Performance
ATTO Disk Benchmark v2.46
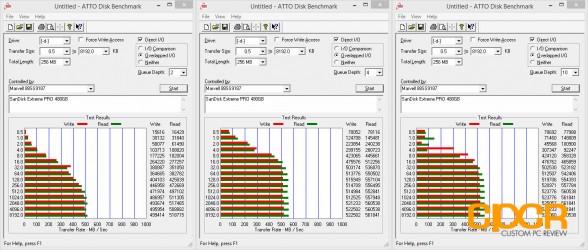
ATTO Disk Benchmark is one of the industry’s oldest and most popular benchmarks for testing disk read/write speeds. This benchmarks allows read and write testing using predefined block sizes and gives us a good idea of read/write speeds with different sized files. Most SSD manufacturers prefer using this benchmark when advertising SSDs as it tests using compressible data, which tends to yield best performance.
Performance Analysis
As the usual with practically every modern enthusiast SSD these days, the SanDisk Extreme PRO is capable of up to 562MB/s sequential reads and 523MB/s sequential writes in ATTO Disk Benchmark.
AS SSD Benchmark
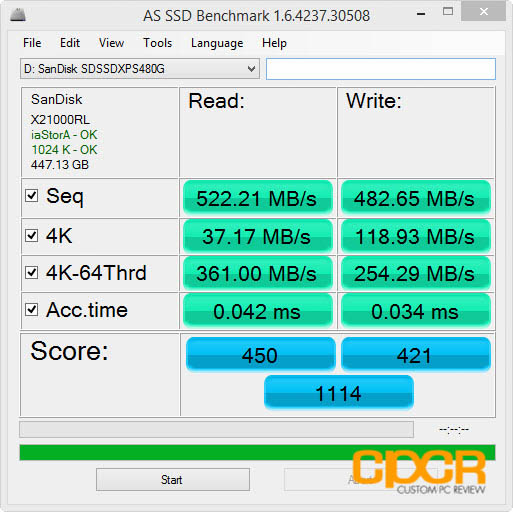
AS SSD is a very commonly used benchmark used to measure SSD performance in a number of categories. Here, tests are run using incompressible data at QD1. It also outputs a final score at the conclusion of the test based off the read and write performance of the drive.
Performance Analysis
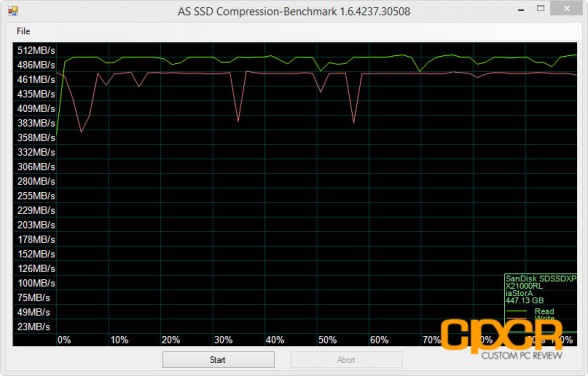
AS SSD results were fantastic as well with the drive pulling ~500MB/s sequential reads/writes and 37/119 MB/s 4K random reads/writes.
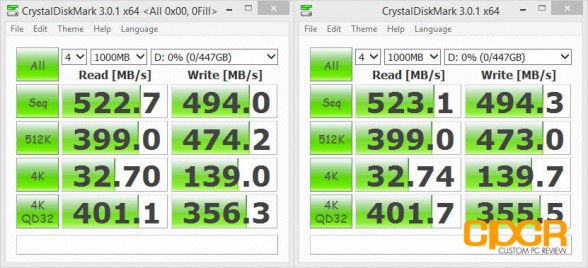
Crystal Disk Mark 3.0.1 x64
Crystal Disk Mark is another popular benchmark which allows us to measure both sequential read/write speeds as well as random read/write speeds. With this benchmark, tests can be run using both random fill (incompressible data) and 0 fill (compressible data). Realistically in typical computer usage scenarios, data being transferred will consist of a mixture of both incompressible and compressible data.
Performance Analysis
Crystal Disk Mark mirrors the results in AS SSD. 512K and 4K random performance is very high, which is something that sets enthusiast products apart from mainstream/budget SSDs.
[section label=6. PC Mark 7 / PC Mark 8]
SanDisk Extreme PRO 480GB Performance
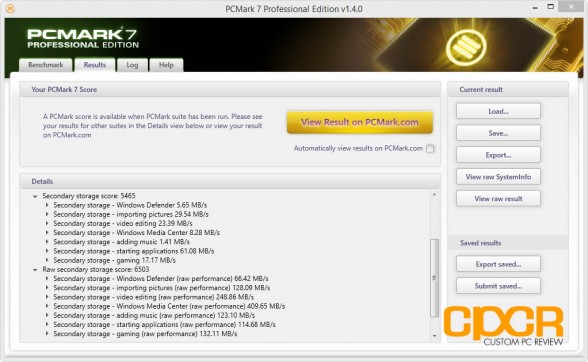
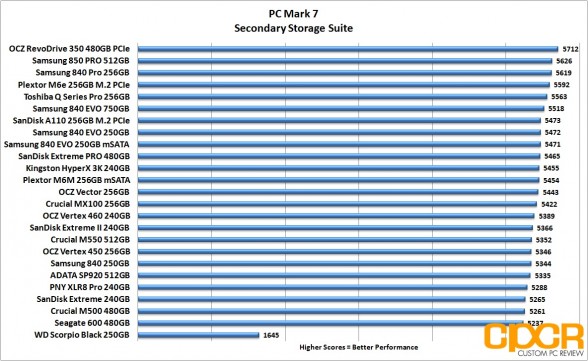
PC Mark 7 Storage Benchmark
The PC Mark 7 storage benchmark evaluates the SSD under many different real world environments such as gaming, multimedia editing, etc. This closely represents the SSD’s performance under real world situations.
Performance Analysis
In PC Mark 7, the SanDisk Extreme PRO doesn’t do as well as some of the SSDs designed for lighter workloads. It does however beat its predecessor, the SanDisk Extreme II.
PC Mark 8 Expanded Storage Benchmark
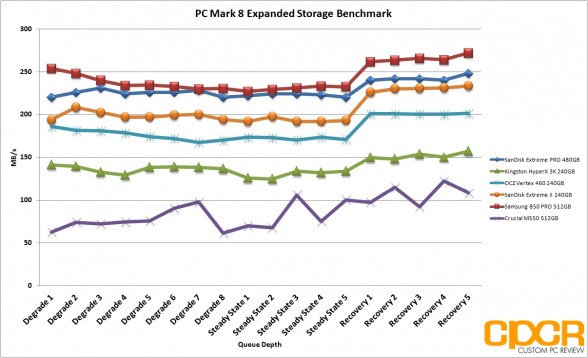
With the introduction of PC Mark 8 2.0.228, Futuremark added the option for an Expanded Storage Benchmark which is literally designed to bring any storage system its absolute limits. The new PC Mark 8 Expanded Storage Benchmark takes around 24 hours to run and for our purposes, we’ll be using the consistency test which measures performance consistency, degradation tendency, and recovery speed of a storage system.
Consistency Test
Full details on the consistency test can be found in the PC Mark 8 Technical Guide here. For the more simplified version, the test is basically a near 24 hour, five phase benchmark – three of which we’ll be reporting on in our results below.
- Phase 1 is a precondition phase designed to “dirty” the drive with random data. The entire drive is filled twice to the capacity of the drive.
- Phase 2 is a degrade phase where the drive is hammered with tons of random data followed by a performance test run. This is done 8 times.
- Phase 3 is the steady state phase where the drive is once again hammered with tons of random data followed by a performance test run. This is done 5 times.
- Phase 4 is the recovery phase where the drive is given 5 minutes to rest followed by a performance test run. This is done 5 times.
- Phase 5 is the clean up phase where the drive is simply secure erased.
Performance Analysis
While the SanDisk Extreme PRO isn’t the fastest when it comes to lighter workloads, what it does extremely well is heavy workloads for an extended period of time. Looking at our results on the PC Mark 8 Expanded Storage Benchmark, the SanDisk Extreme PRO edges out the already quick SanDisk Extreme II, although it’s still bested by the recently released Samsung 850 PRO which uses next generation Samsung V-NAND technology.
[section label=7. FIO – FOB]
SanDisk Extreme PRO 480GB Performance
FIO (Flexible I/O Tester)
FIO, which stands for Flexible I/O Tester, is basically what its name says – a flexible I/O tester / I/O workload generator. Whereas all the benchmarking tools we’ve used previously are fantastic, easy to use benchmarking tools that provide a good snapshot of SSD performance, they do lack a lot of versatility, especially for more complex and in-depth operations such as custom queue depths, block sizes, test run times, etc. While the testing that follows may not pertain to typical consumer usage, they do help give us a much more in-depth look at each individual product’s strengths and weaknesses when they’re pushed to the limits.
FIO – FOB (Fresh Out of the Box) Testing
When SSDs are brand new and Fresh Out of the Box, they’re generally able to perform at or outperform their advertised speeds, but unlike traditional hard drives, performance on SSDs begin to degrade over time as they become more and more used. This is because while SSDs are new, all bits on the SSD are empty, so they can instantly be programmed with data. However, once data gets programmed in, even if it’s deleted in the filesystem the actual data will still stay programmed on the NAND itself unless some sort of garbage collection routine comes in to wipe the data. Unfortunately, in order to write new data onto “dirty” NAND, the NAND needs to go first through an erase cycle to erase the old data before a program cycle can happen to program new data, which as you may imagine takes more time than just a simple program cycle. As this only happens when writing new data onto the SSD, you’ll generally see less performance degradation on reads and more performance degradation on writes.
For our FOB testing, we run a secure erase on the SSD then run each test sans any preconditioning. This will provide us with the highest level of performance the SSD is capable of and is likely never to be seen ever again once the SSD goes into a used state.
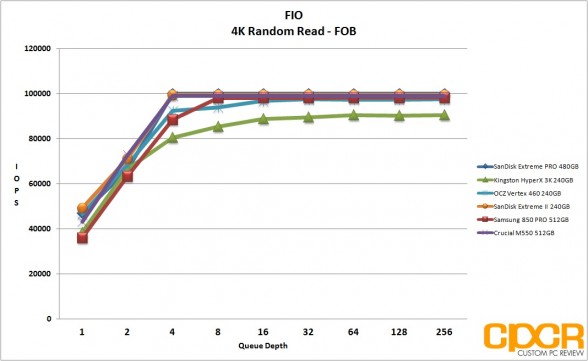
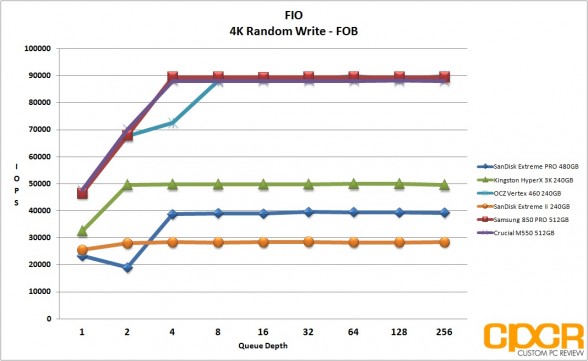
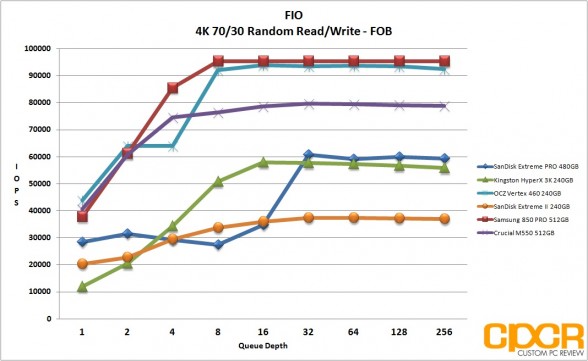
Our testing will include 4K read testing, 4K write testing, and 4K 70/30 read/write mix testing at queue depths of 1,2,4,8,16,32,64,128,256. The reason we’ve also included 4K 70/30 read/write mix testing is simply because most real world workloads will always fall somewhere between 0% write and 100% write rather than one or the other. Since client usage is much more read heavy, we’ll be using the 70/30 read/write mix.
For general client usage, performance will fall somewhere between queue depths of 1-4 whereas servers and other enterprise applications will easily see queue depths of 32 or greater.
Performance Analysis
Fresh out of the box, the SanDisk Extreme PRO is fairly quick with 4K random reads maxing out at the magical 100,000 IOPS mark. Unfortunately, 4K random writes aren’t nearly as good with the drive maxing out at ~40,000 IOPS. That said, it’s still a significant improvement over the SanDisk Extreme II which struggled to pull anything over 28,000 IOPS.
[section label=8. FIO – Steady State]
SanDisk Extreme PRO 480GB Performance
FIO – Steady State Testing
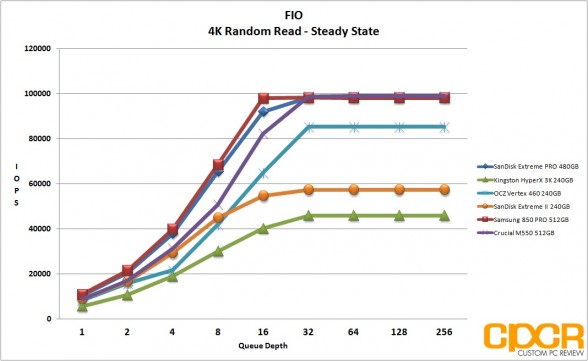
After prolonged use of an SSD, it will reach “steady state” where performance levels off to a minimum level. The FOB state is the “best case scenario” for SSD performance while “steady state” is going to be your worst. Here, we ran the exact same set of benchmarks we just completed in the FOB state; except this time around, we’ll be preconditioning the drive by filling 100% of the drive’s LBAs with two sequential passes of 128k data followed by hammering the drive for six hours with 4K random data prior to actual testing.
Performance Analysis
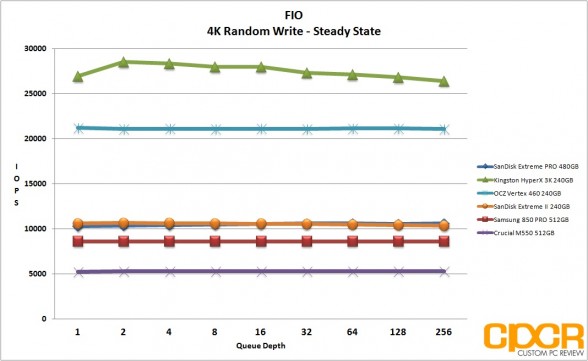
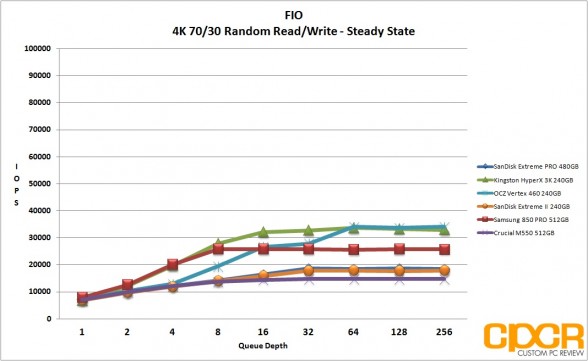
In steady state, the SanDisk Extreme PRO’s 4K random reads are by far the biggest improvement over the SanDisk Extreme II as steady state doesn’t affect the SanDisk Extreme PRO’s performance. Unlike the SanDisk Extreme II which saw performance drop to a maximum of ~57,000 IOPS in steady state, the SanDisk Extreme PRO maintains its performance, maxing out at 98,000 IOPS at QD16 and beyond. 4K random writes were decent as well with the Extreme PRO pulling just over 10,000 IOPS.
[section label=”9. FIO – 4K Random Write Consistency”]
SanDisk Extreme PRO 480GB Performance
FIO 4K Random Write Consistency Testing
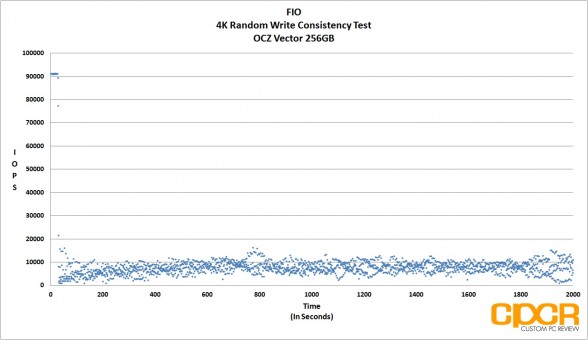
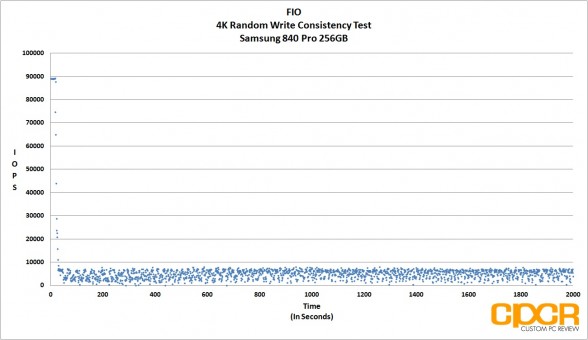
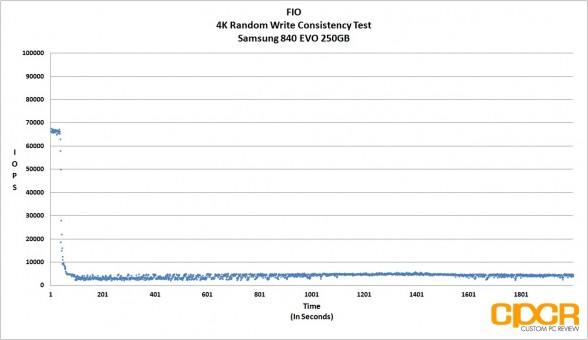
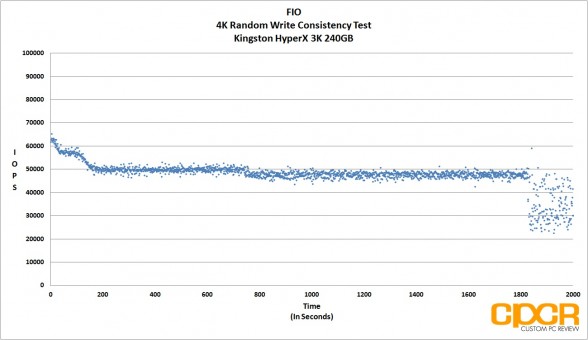
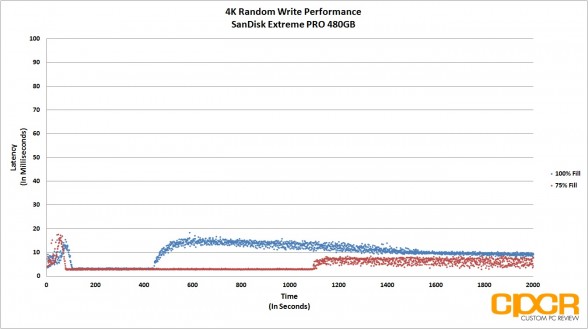
Another one of the benefits of testing with FIO is the flexibility of running consistency tests, which is one of the most important metrics when considering SSDs going forward. Looking at the results of our benchmarks such as ATTO Disk Benchmark and Crystal Disk Benchmark, we can see that practically every top tier SSD is capable of saturating SATA 6Gb/s in the FOB state. However, what really differentiates these SSDs is their ability to hold a certain level of performance even after extended periods of use.
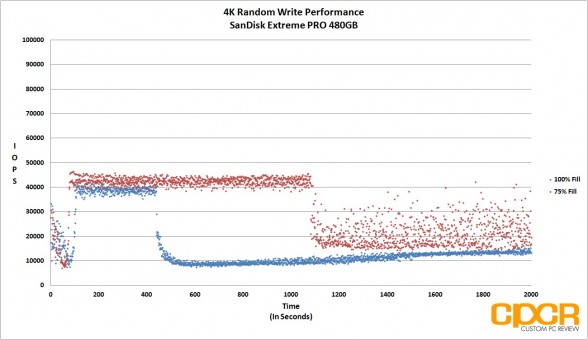
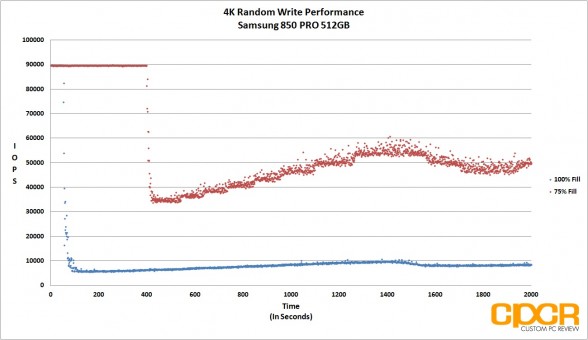
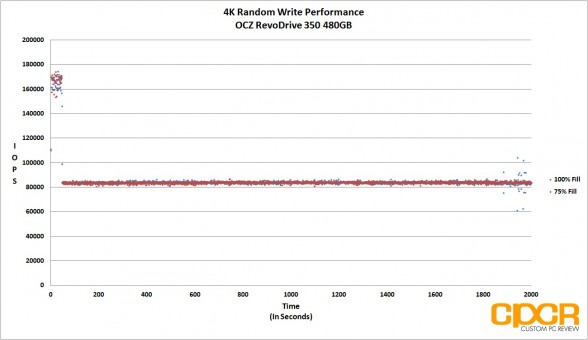
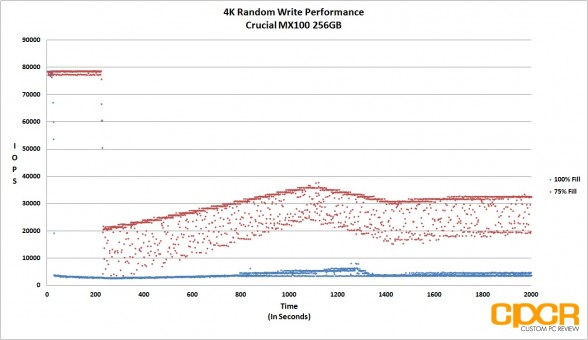
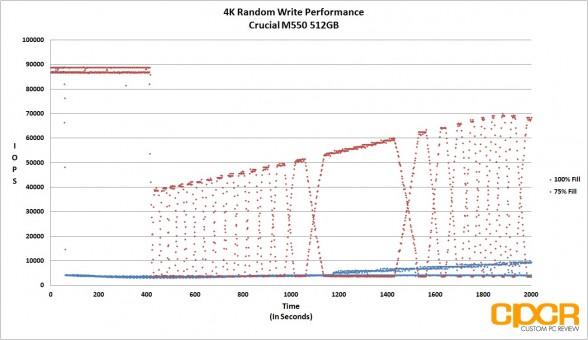
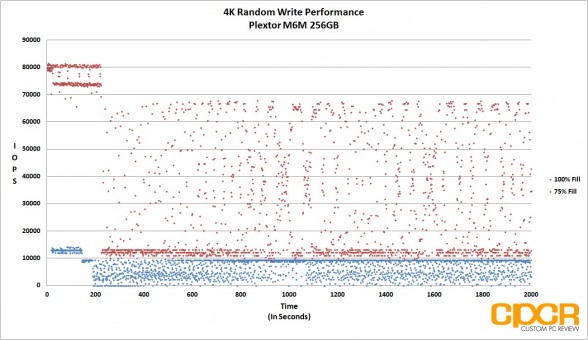
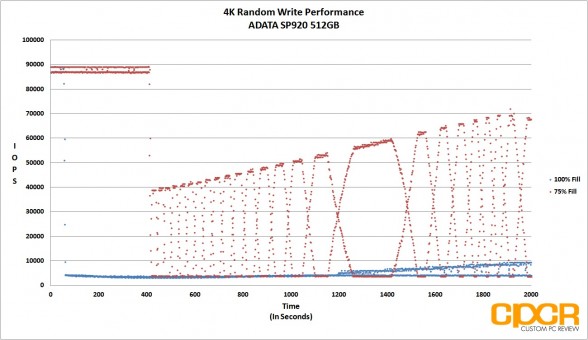
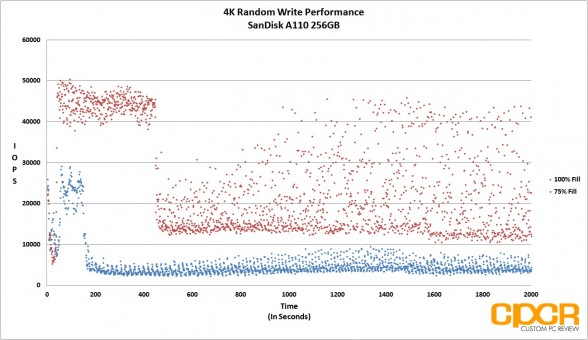
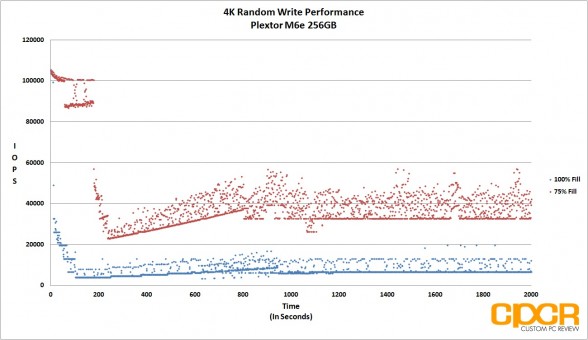
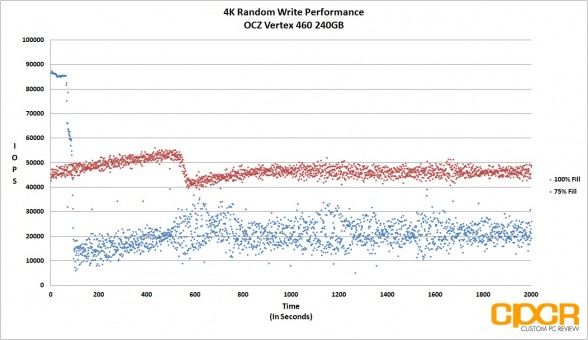
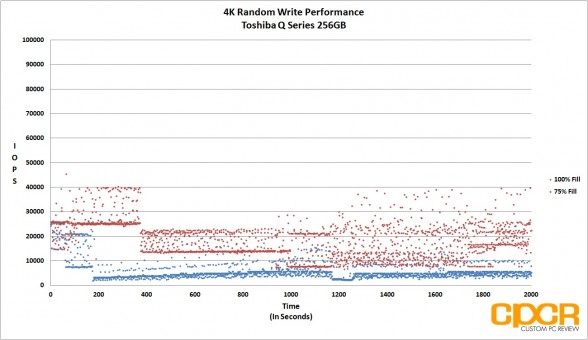
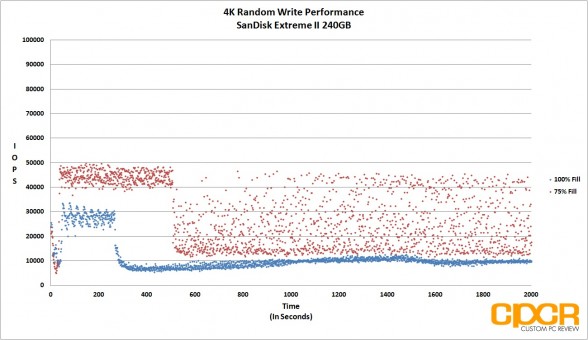
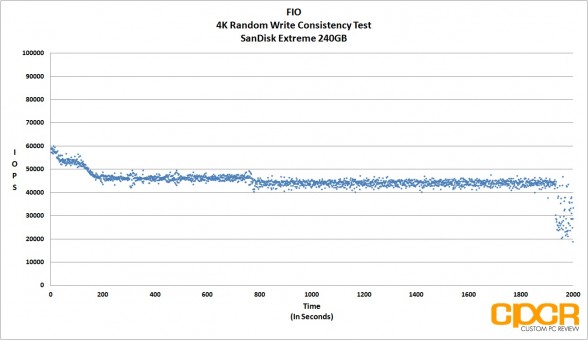
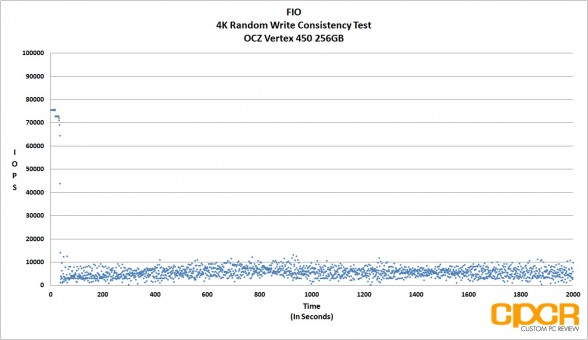
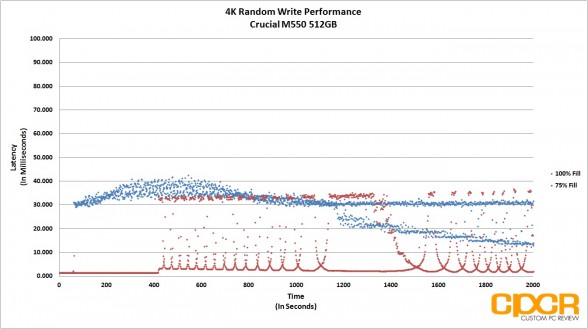
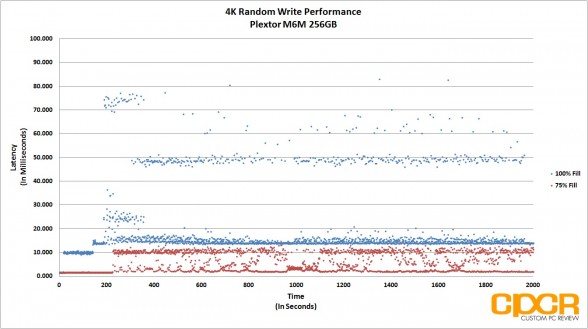
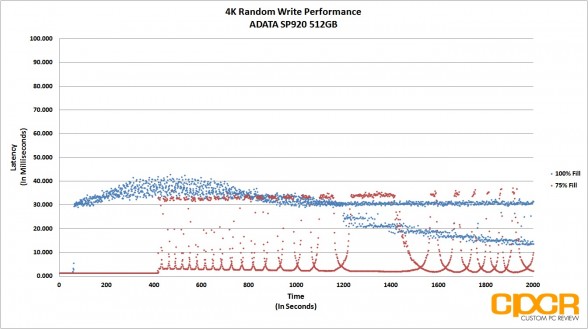
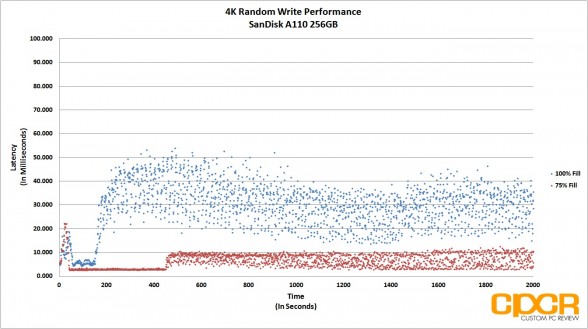
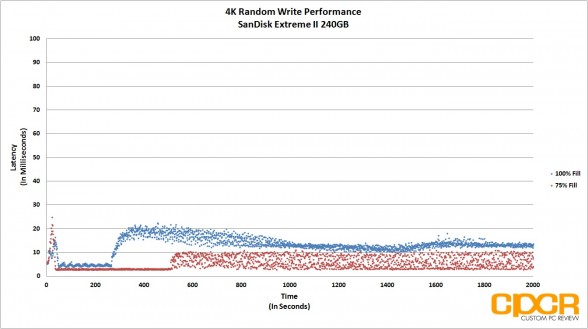
For our consistency testing, we used a fairly standard method, which includes both filling up 75% of capacity as well as 100% capacity twice with sequential 128k data followed by the actual test itself, which is simply running 4K random writes at a queue depth of 32. By recording the IOPS every second for 2,000 seconds, we’re able to get a good look at what kind of performance can be expected when the drive is relatively new, when it’s heading towards steady state, and when it’s actually in steady state.
[tabgroup]
[/tabgroup]Performance Analysis
Looking at our 4K random write trace, we can see that the SanDisk Extreme PRO is able to improve upon the already excellent performance of the SanDisk Extreme II. Performance consistency at 100% fill is excellent although SanDisk still needs to improve consistency at 75% fill.
[section label=”10. FIO – 4K Random Write Latency”]
SanDisk Extreme PRO 480GB Performance
FIO 4K Random Write Latency Testing
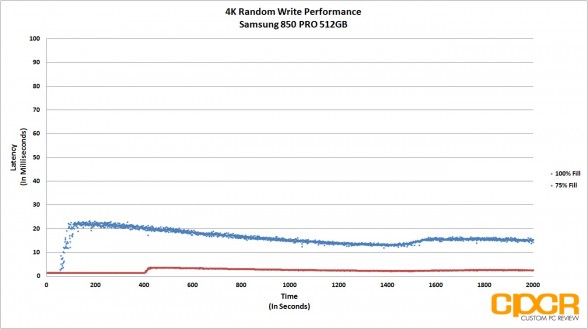
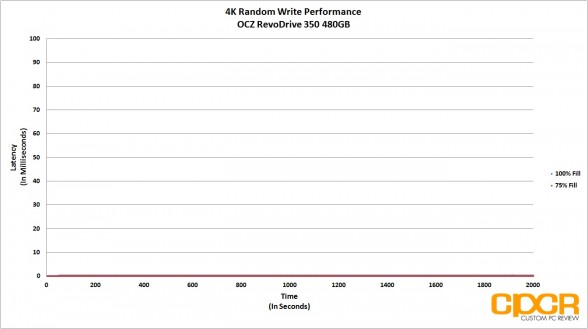
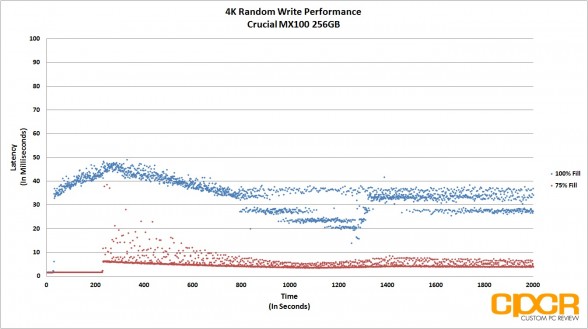
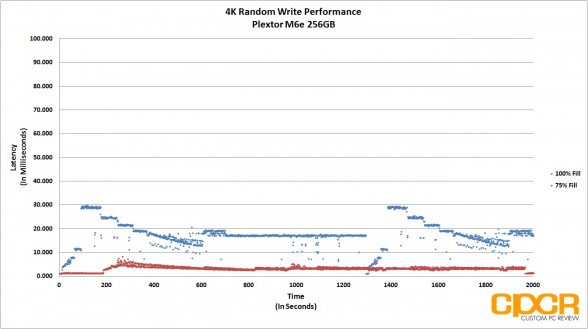
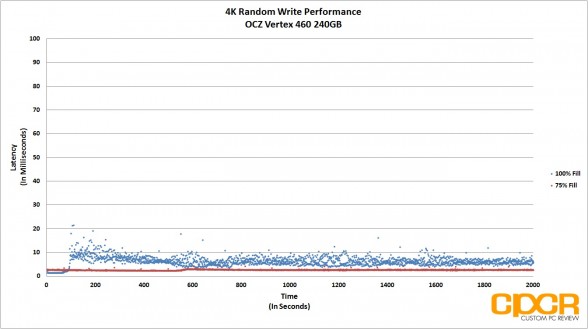
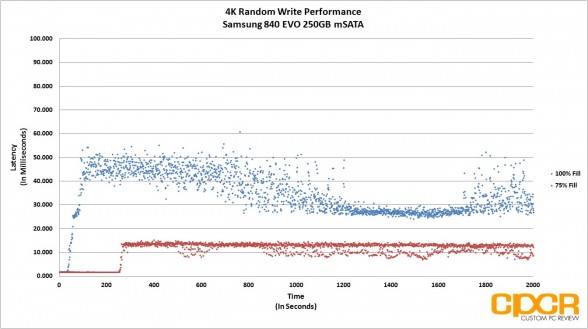
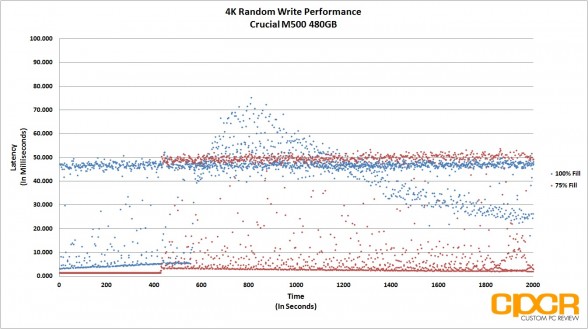
Another metric that’s becoming increasingly important in SSDs is its ability to keep latency low despite being subjected to a heavy workload. Even if a SSD were capable of ultra high and ultra consistent IOPS performance, if latency were high, users would still feel that the drive is slow. Ideally, SATA SSDs should always be capable of latencies under 50ms, even during heavy workloads.
For latency testing, we’ll be using the exact same testing parameters as IOPS consistency testing, except instead of recording IOPS every second, we’ll be recording latency.
[tabgroup]
[/tabgroup]Performance Analysis
Latency was excellent as the SanDisk Extreme PRO was able to keep latency under 20ms throughout our testing.
[section label=”11. FIO – 128K Random Write”]
SanDisk Extreme PRO 480GB Performance
FIO 128K Random Write Consistency Testing
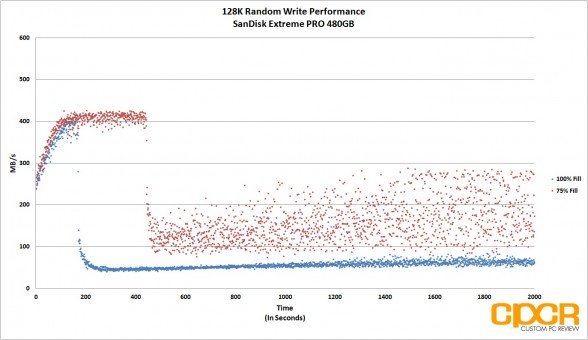
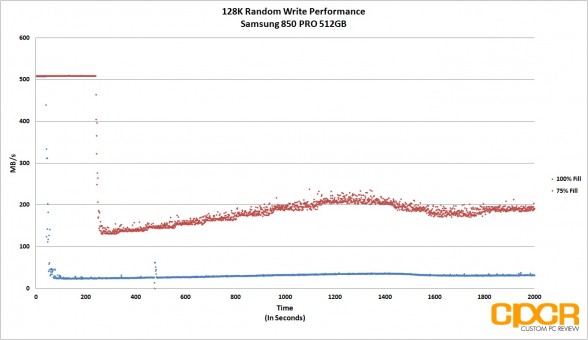
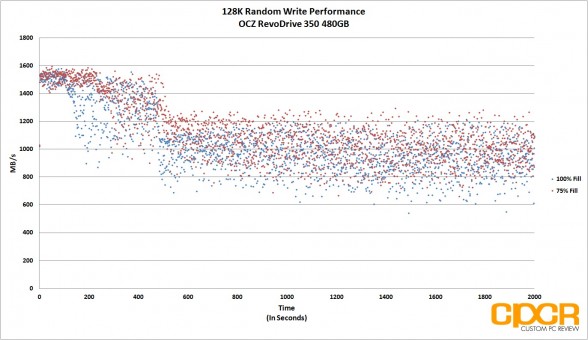
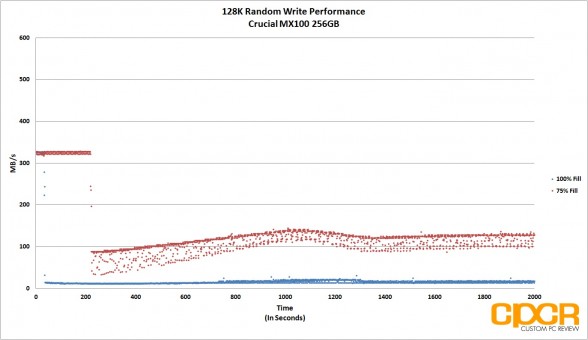
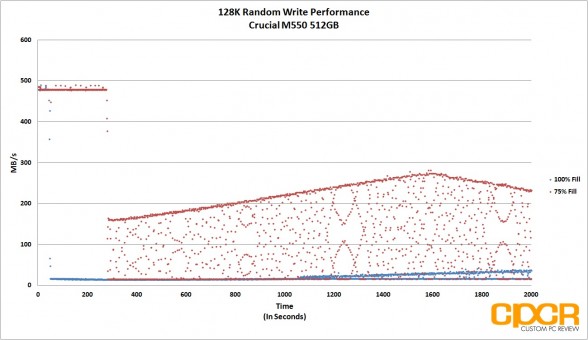
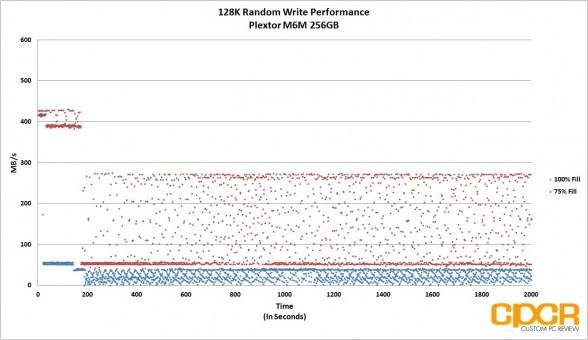
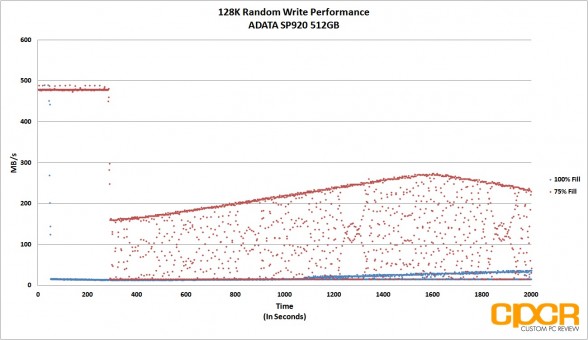
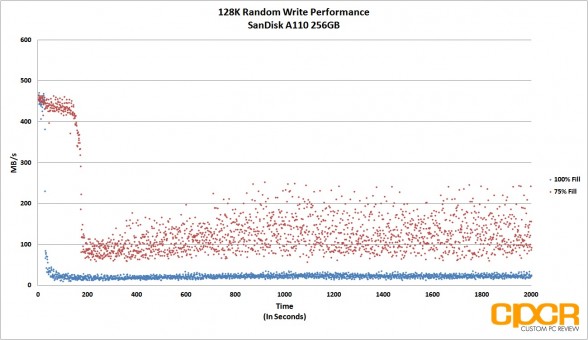
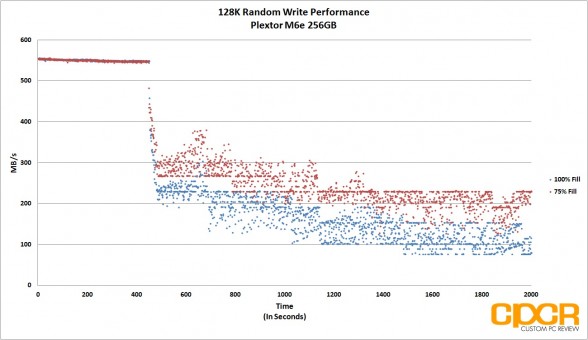
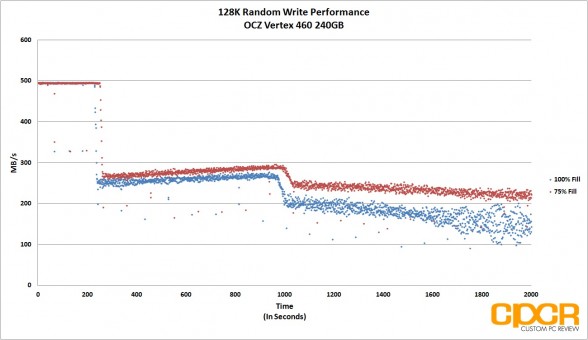
In addition to testing 4K random write consistency, we’ll also begin to test for 128K random write consistency to see how well a SSD is able to hold itself to a level of performance when getting hammered with larger file transfers.
For 128K random write consistency testing, we won’t be preconditioning the drive with two sequential passes of 128K data like in our 4K random write consistency testing since 128K data can easily fill up the drive well within our 2,000 second run.
[tabgroup]
[/tabgroup]Performance Analysis
The SanDisk Extreme PRO is able to deliver fairly consistent 128K writes, with the drive capable of up a very consistent ~50 MB/s with the drive at 100% fill. Backing off to 75% fill, performance increases dramatically however, like 4K random writes, consistency decreases with a variance of as much as ~200 MB/s during our testing.
[section label=”12. Power Consumption”]
SanDisk Extreme PRO 480GB Power Consumption
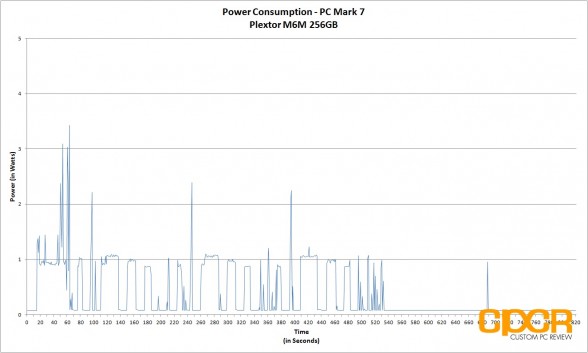
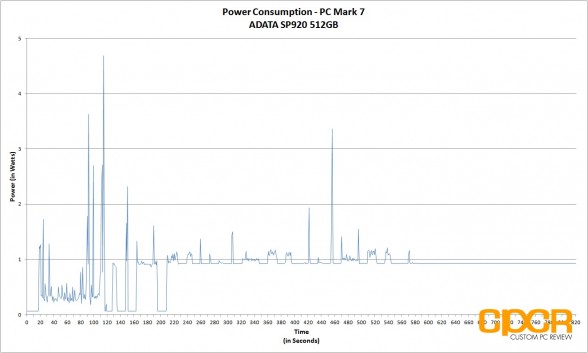
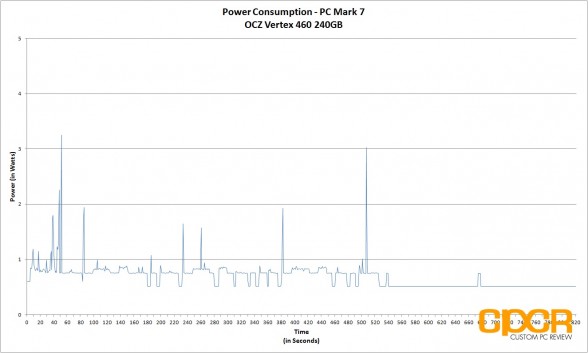
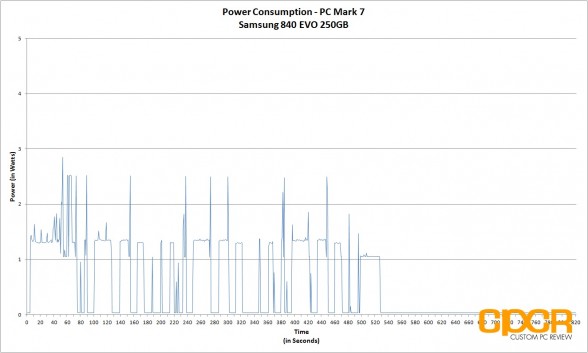
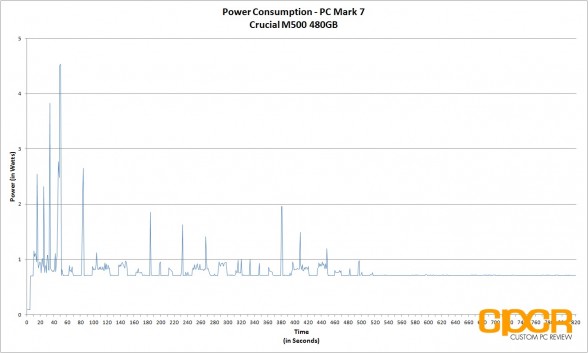
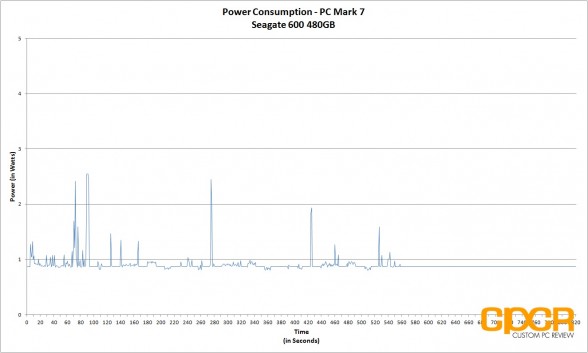
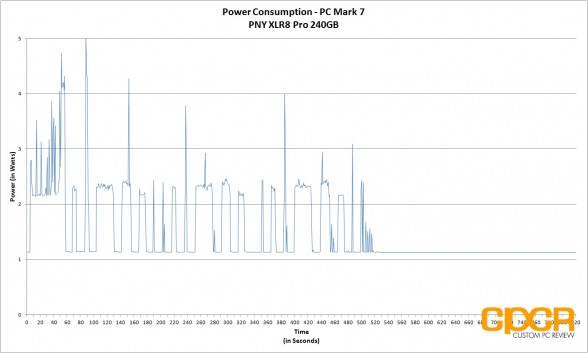
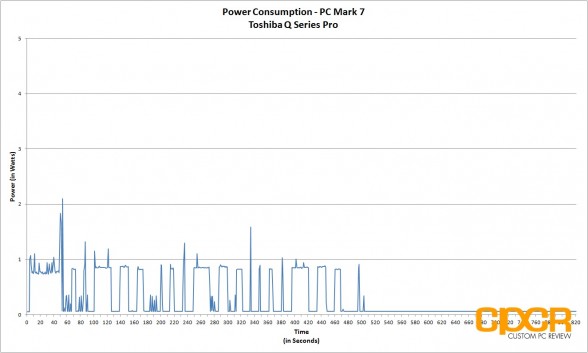
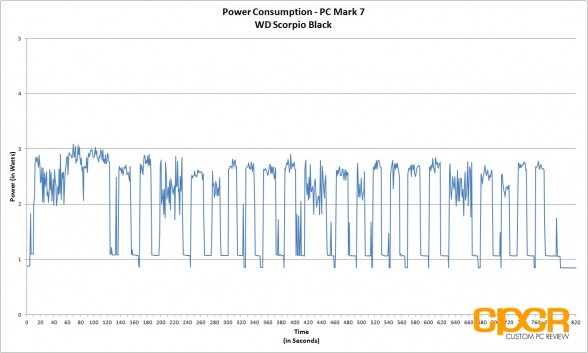
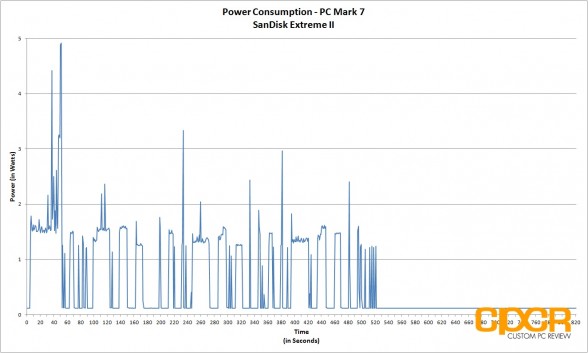
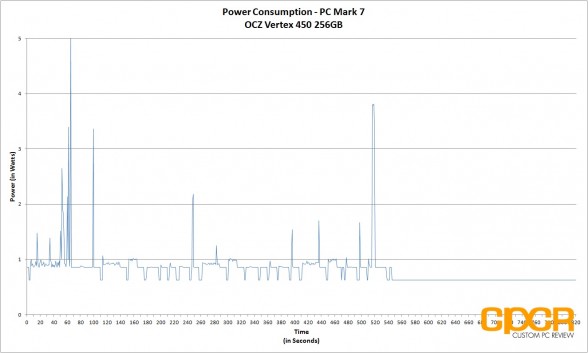
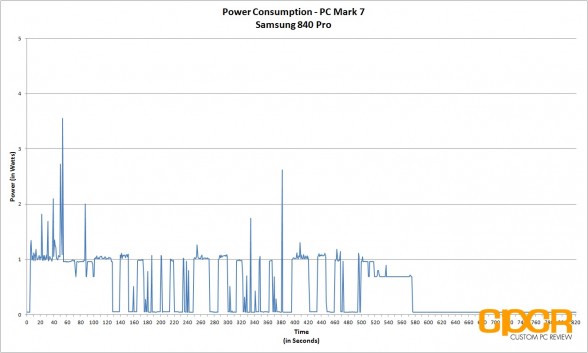
Previously, our power consumption analysis only tested for idle and maximum load power consumption, but we felt that this was a bad way to accurately measure power consumption. The reason for this is because SSDs tend to be bursty while in operation and will spike in power usage, but only for very short periods of time. As such, many of our SSDs appeared to have even higher power consumption than traditional hard drives, which is untrue.
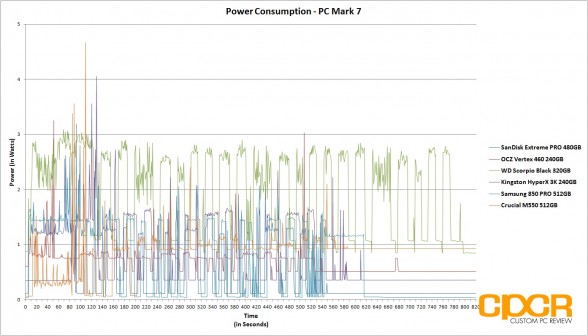
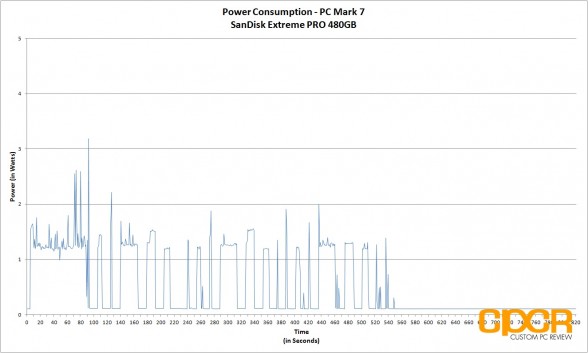
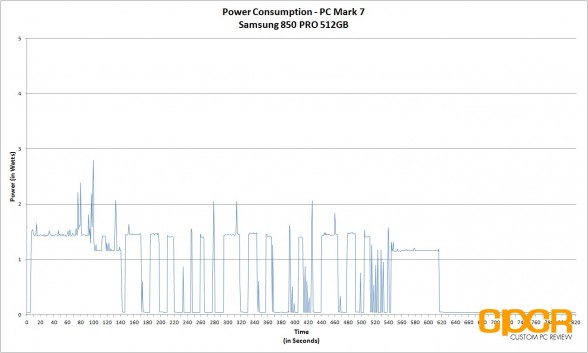
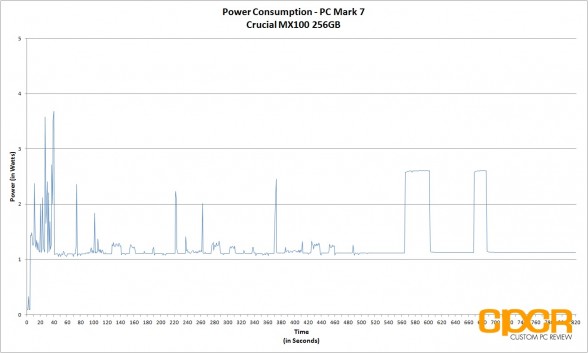
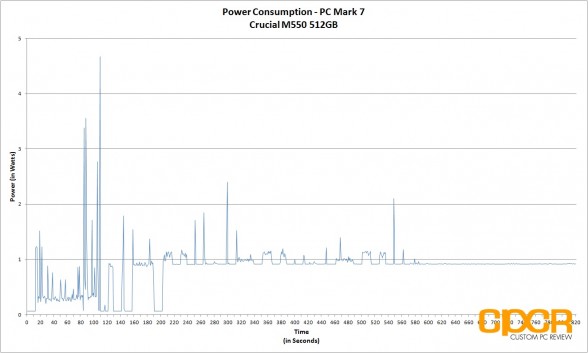
In order to better represent a drive’s power consumption, our solution was to run a test closer to the real-world and record a trace of the exact power consumption during testing. Since PC Mark 7 has been recognized by the industry as a fantastic real-world benchmark, we’ll be recording the drive’s power consumption while running the benchmark.
All tests below are measured by our B&K Precision 5491B Bench Multimeter tapped directly into the 5v line running from the power supply to the drive. All testing here is conducted with “HIPM (Host Initiated Power Management)/DIPM (Device Initiated Power Management)” enabled and “AHCI Link Power Management – Adaptive” set to 0 milliseconds for maximum power efficiency.
[tabgroup]
[/tabgroup]Performance Analysis
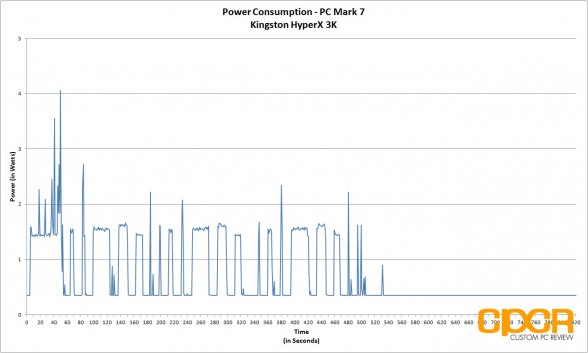
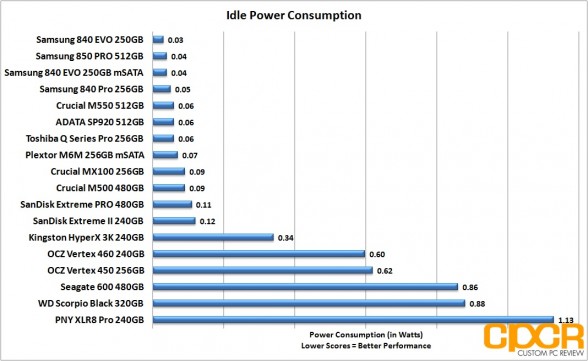
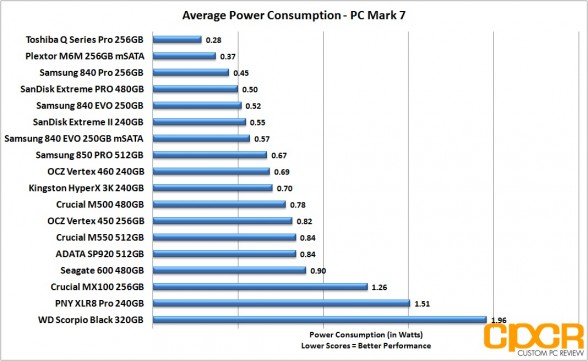
Since the SanDisk Extreme PRO is using nearly the same hardware as the Extreme II, power consumption was quite good with the drive drawing ~0.11w at idle and ~0.50w at load during our PC Mark 7 testing. Looking at our trace, the SanDisk Extreme PRO is extremely aggressive in keeping power consumption low, quickly dropping to the active idle power state after each test.
[section label=13. Conclusion]
SanDisk Extreme PRO 480GB Conclusions
 With the SanDisk Extreme PRO, SanDisk is continuing to step up their game in the enthusiast SSD sector, flexing their power as a SSD manufacturer with their own fab. Unlike SSD vendors who rely on third parties for controllers, NAND, and firmware, SanDisk’s ability to do most of this in-house gives them the ability to implement unique features such as nCache PRO, significant firmware optimizations, or a 10 year warranty. This is what sets top tier SSD vendors apart and it’s great seeing SanDisk continuing to push the envelope in the enthusiast market.
Performance on the SanDisk Extreme PRO is definitely one of the best we’ve seen to date. Unlike many vendors in the market who simply focus on burst performance to advertise their drives at certain performance levels, SanDisk takes a different route, instead focusing on steady state and sustained performance. This is why the SanDisk Extreme PRO behaves almost like an enterprise drive in both PC Mark 8 Extended and steady state testing, ensuring that the drive will not only be fast when it’s fresh out of the box, but continue to be fast even after years of heavy usage.
| Manufacturer | SanDisk | SanDisk | SanDisk |
|---|---|---|---|
| Model | Extreme PRO | Extreme PRO | Extreme PRO |
| Capacity | 240 GB | 480 GB | 960 GB |
| Street Price | $195.99 | $369.99 | $599.99 |
| Price/GB | ~$0.82 | ~$0.77 | ~$0.62 |
| Check Price | Click Here | Click Here | Click Here |
The SanDisk Extreme PRO 480GB can currently be found at various e-tailers for ~$369.99, which is ~0.77/GB. Considering it’s level of performance and 10 year warranty, this is a very reasonable price. The SanDisk Extreme PRO 960GB however is definitely the best deal coming in at ~$599.99, translating to ~$0.62/GB. Considering only a year ago that was the price for a mainstream SSD, we’ve sure come a long way.
Now to address the elephant in the room, the Samsung 850 PRO. Without a doubt, the Samsung 850 PRO has recently become the biggest competitor to the SanDisk Extreme PRO. When SanDisk unveiled the Extreme PRO back at Computex, it was no doubt the best SSD on the market. Based on the information I was given at the time, it was not only one of the fastest SSDs client SSDs available, but SanDisk also gave it an unprecedented 10 year warranty to match – something that no other SSD vendor had done previously. Unfortunately for SanDisk, later that month Samsung fired back with the Samsung 850 PRO using next generation 32-layer 3D V-NAND, which in testing has proved to be far superior to traditional 2D planar NAND. If over-provisioned like the Extreme PRO, the Samsung 850 PRO offers better performance, TCG Opal 2.0/IEEE-1667 encryption features, a superior software stack, higher rated endurance and the same 10-year warranty. It’s simply a superior product that SanDisk can’t match without moving to next generation NAND.
That said, I’m not implying that the SanDisk Extreme PRO is a bad product. Not by a long shot. In fact, the SanDisk’s Extreme PRO is still the fastest, most consistent 2D planar NAND based client SSD money can buy. While I’d recommend the Samsung 850 PRO for those looking for the best client SSD out there, the SanDisk Extreme PRO is still a top tier product that’s worth serious consideration if the price is right. Depending on how competitive SanDisk intends to be in the client space over the next couple months, we could possibly see the beginning of an enthusiast SSD price war by the end of this year – a huge win for consumers down the road.
Sample provided by: SanDisk
Availability: Amazon

